|
12/1/2017 0 Comments Trials, Results, and ConclusionsThe conduction of trials went as smoothly as hoped. In order to determine the effect of chlorinated and non chlorinated water on bacteria growth, a two-sample t test was conducted to compare the mean value of bacteria colonies in both chlorinated and non chlorinated water. The same process was done as used in pretrials as no errors were encountered in the experimental process.
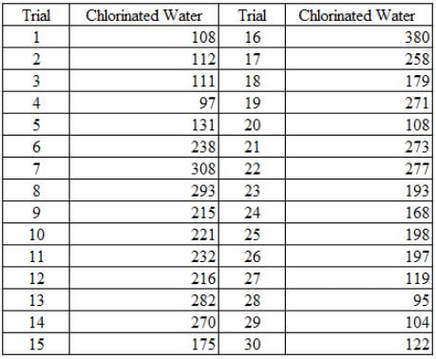
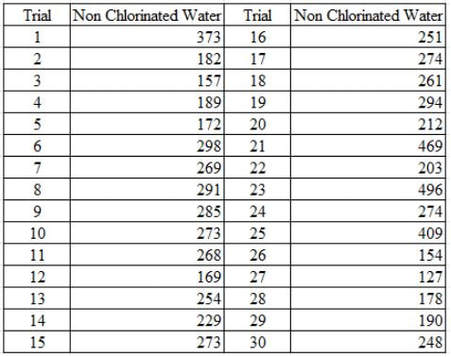
The table on the left shows the number of bacteria colonies that grew in the Petri dishes from chlorinated water for all 30 trials. The table on the left shows the number of bacteria colonies that grew in the Petri dishes from non chlorinated water for all 30 trials. 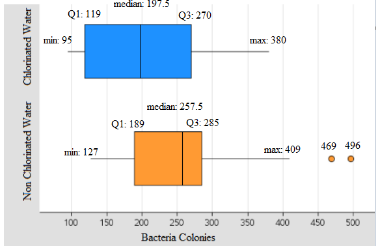 Shown above are the box plots representing the data. The blue box plot on the top represents the number of bacteria colonies for chlorinated water. The orange box plot on the bottom represents the number of bacteria colonies for non chlorinated water. On average, chlorinated water contained about 198 bacteria colonies (you cannot have 0.5 of a bacteria colony); non chlorinated water contained about 256 bacteria colonies. There were two outliers for non chlorinated water; therefore, two two-sample t tests will be done, one with the outliers and one without. 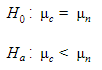 Above shows the null and alternative hypothesis. The null hypothesis, Ho, states that the mean of the bacteria colonies in chlorinated water, c, will be the same as the mean of the bacteria colonies in non chlorinated, n. The alternative hypothesis, Ha, states that the mean of bacteria colonies in chlorinated water will not be less than the mean of the bacteria colonies in non chlorinated water. 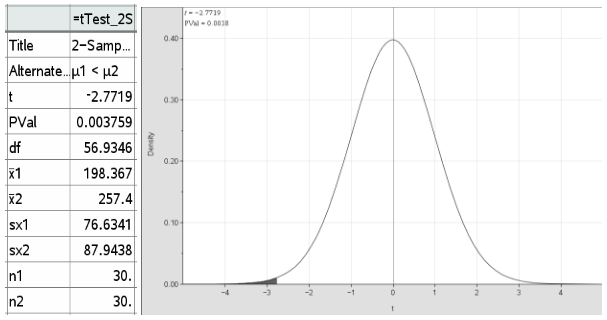 The chart and graph above shows the results of the two-sample t test with the outliers included. The t-value is -2.7719 meaning the number of standard deviations away from the mean. The t-value can be used to find the p-value, either by hand using table C in The Practice of Statistics, or in this case, the p-value can be automatically found using the TI-NSpire computer software. Based on the results of the two sample t-test, the null hypothesis is rejected because the p-value of 0.003759 is less than the alpha level, , 0.05. There is evidence to believe that the number of bacteria colonies in chlorinated water is less than the number of bacteria colonies in non chlorinated water. There is only a 0.3759% chance that chlorinated water contained less bacteria than non chlorinated water by chance alone. 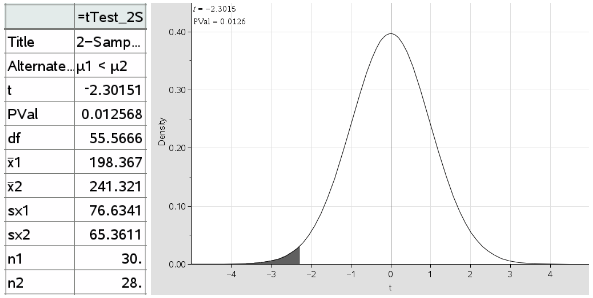 The chart and graph above show the results of the two-sample t test without the outliers included. The t-value is -2.3015,1 meaning the number of standard deviations away from the mean. The t-value can be used to find the p-value, either by hand using table C in The Practice of Statistics, or in this case, the p-value can be automatically found using the TI-NSpire computer software. Based on the results of the two sample t-test, the null hypothesis is rejected because the p-value of 0.012568 is less than the alpha level, , 0.05. There is evidence to believe that the number of bacteria colonies in chlorinated water is less than the number of bacteria colonies in non chlorinated water. There is only a 1.2568% chance that chlorinated water contained less bacteria than non chlorinated water by chance alone. Overall, it can be concluded that chlorinated water contains fewer bacteria colonies than non chlorinated water. We believe this is do to the presence of chlorine in the chlorinated water. Having chlorine in the water allows for more bacteria to be killed; therefore, making the water cleaner. Without the presence of chlorine in the non chlorinated water, the bacteria had more of an opportunity to reproduce, allowing for more bacteria colonies to grow. If this project were to be done again, multiple improvements would be made. a few errors were encountered after reviewing the experiment; incubation time and the straining method of the bacteria. The incubation time for each Petri dish was different from trial to trail due to the variance in the daily class schedules. Biology was not during the same time everyday, so the incubation time was not consistent. The time varied from about 1-2 hours each trial, depending on when biology was scheduled. The straining method used also posed a problem. When straining the bacteria, Kara had to hold down the sterilized coffee filters in the funnel so that they did not fall through the funnel. This allowed for the transfer of the bacteria from her hands to the coffee filter. In order to correct this, if we were to run this experiment again, whoever has to hold the coffee filters in place would wear sterilized gloves. The video below shows the straining method used for the experiment. If anyone wishes to do research on this topic, we would encourage them to go for it. Although it seems fairly simple, it reveals interesting things that you would have never thought to think about. We would suggest being careful about cross contamination when working with the bacteria in water because you don't want outside factors getting into your water, increasing or decreasing the actual amount of bacteria within the water. In order to further this research, we could test different amounts of chlorine within the water. We already know that chlorinated water contains fewer bacteria than non chlorinated, so testing different amounts of chlorine in the water. We would be able to see which amount kills off the most amount of bacteria, while still being safe for humans to consume.
0 Comments
Leave a Reply. |